Debt Portfolio Analytics for CRE Lenders Tracking Loan Book Risk
Portfolio risk hides between individual loans, not within them.

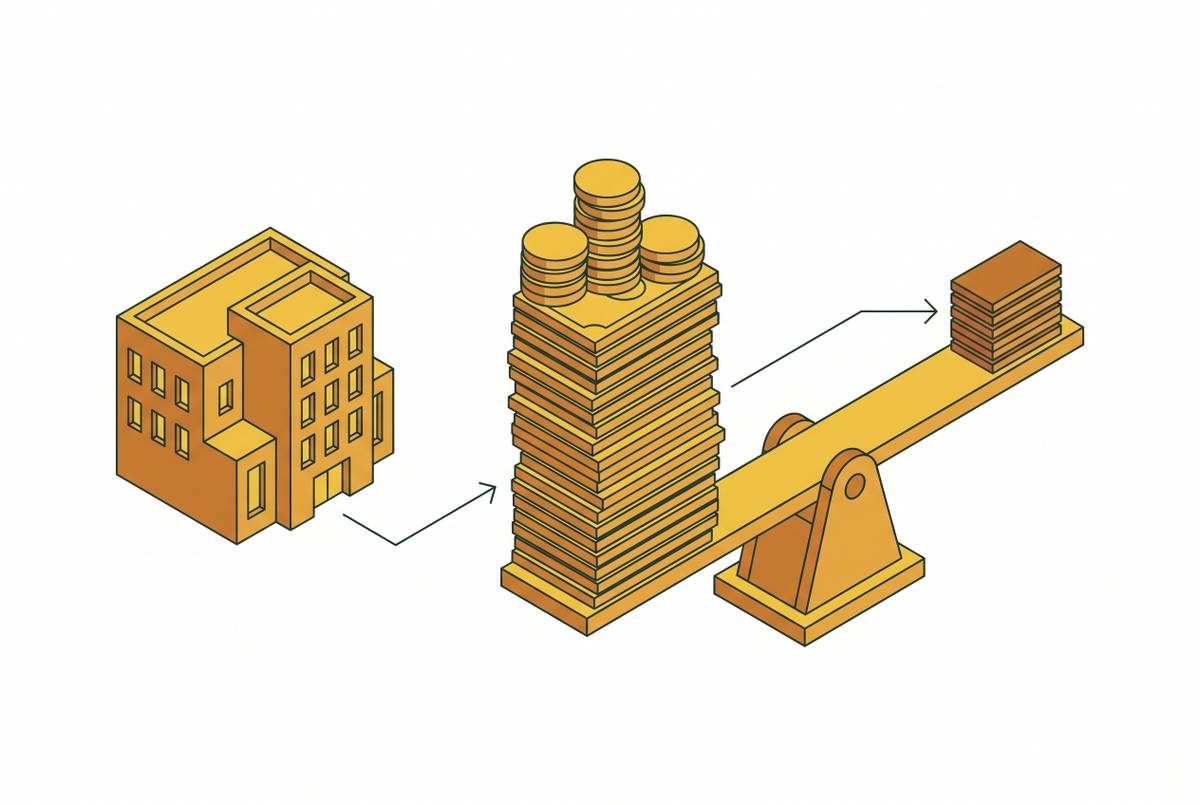
If a chief credit officer oversees several hundred active CRE commitments, they can read every file and still not see where the portfolio is exposed. That is the central claim of this piece: loan-level review answers whether a single credit should be approved and on what terms, while portfolio risk accumulates in the spaces between loans, in concentration, in correlated exposure, in timing, where no single file ever shows it. Debt portfolio analytics exists to close that gap, not to replace underwriting but to sit alongside it as a separate discipline with a separate question.
Why Loan-Level Review Fails to Reveal Where CRE Portfolio Risk Is Actually Building
A bank with three hundred active CRE loans spread across office, multifamily, industrial, and retail, in a dozen metro markets, has three hundred answers to the question "should we have made this loan, on these terms." It does not automatically have an answer to the question that actually matters: where risk is building across the book right now, which borrowers need attention this month, and which exposures are drifting off plan before the next reporting cycle even begins. Underwriting is built to answer the first question. Nothing about it is built to answer the second, and treating the two as the same exercise is where portfolio blind spots start.
A loan file stays still, but real estate risk does not. A construction loan's exposure shifts as the project moves from foundation to framing to lease-up. A stabilized asset's risk profile shifts as a major tenant's lease approaches expiration or as a submarket's vacancy rate climbs. The risk lives in the property and its conditions, not in a static loan summary generated at closing. A lending organization structured around pipeline, underwriting, and servicing as separate stages will naturally produce separate, disconnected snapshots of that asset rather than a continuous record of what is happening to the collateral.
Concentration is the clearest example of a risk that simply does not exist at the loan level. No single loan file tells a credit officer that the bank has built up disproportionate exposure to a single submarket, a single asset type, or a single sponsor's web of related entities. You only see that picture once you pull every active loan together and look at the aggregate. If that aggregation happens once a quarter, or happens only when an examiner asks for it, a bank can accumulate dangerously correlated exposure across dozens of individually sound loans without anyone noticing until the correlation turns into simultaneous stress.
The same logic applies to slower-moving operational risks. A draw request that is pacing faster than construction progress justifies looks unremarkable in isolation, one file among hundreds. An inspection report that has gone stale by sixty or ninety days looks like a scheduling gap, not a risk signal, when reviewed loan by loan. A covenant breach sits quietly in a servicing note until someone checks for it by hand. None of these signals are hidden. They are simply invisible to a process that only ever looks at one loan at a time.
Data Fragmentation Across the Lending Lifecycle
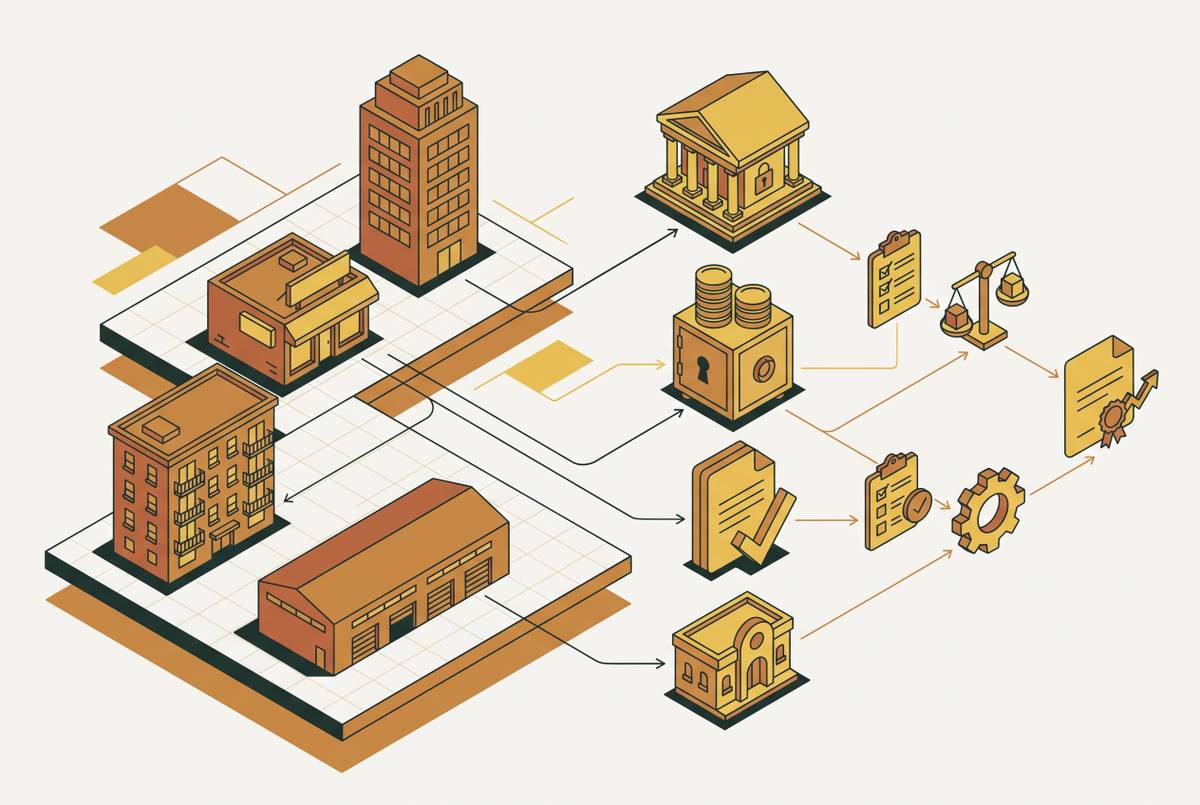
The aggregation gap described above is the predictable output of how lending software gets built: around workflow stages, not around the asset itself. A pipeline tool tracks deal flow. Underwriting lives in spreadsheets built fresh for each deal. A construction management system handles draws and inspections. A servicing platform tracks payments and covenant compliance. Each tool does its job well. None of them is built to carry a single asset's story forward from origination through payoff as one continuous record, so the same property's data ends up scattered across systems that update on different schedules and report to different teams.
CRE lending adds structural complexity on top of that fragmentation. Third-party inspectors and title agents need to coordinate on construction loans, and each one puts out documents on its own schedule. Syndicated loans and participations require a lender to track its specific slice of a larger capital stack. A single sponsor might hold a dozen assets through a web of shell entities and joint ventures, and if nothing connects those entities back to a common ownership structure, you will never see that the bank's real exposure to that sponsor is far larger than any one loan file suggests. None of these are edge cases. They are standard features of CRE lending, and they are exactly the conditions under which fragmented systems fail quietly.
At institutional scale, the work of manually stitching these fragmented views back together becomes its own source of risk. A loan administration team has to pull exposure data from a core banking system, inspection updates from a vendor portal, draw schedules from a separate spreadsheet, and covenant status from email threads, running a manual reconciliation process that cannot scale with the size of the book, and the accuracy of that process degrades as volume grows, regardless of how skilled the team is.
So the volume of data CRE lenders generate has grown, but portfolio visibility has not kept pace. Underwriting, construction monitoring, and asset management all produce useful information, but it stays trapped inside the system that created it. Software built around individual functions produces faster individual reports. It does not produce a clearer picture of the whole book, because no one tool was ever asked to hold that picture. The fix is a system of record that follows data from pipeline to payoff, because without that connective layer, every portfolio view is a reconstruction of where things stood weeks ago, not a picture of where things stand now.
Many banks already know this. They report that their existing systems handle pieces of the problem well enough, origination here, servicing there, but acknowledge that the actual aggregation and risk tiering still happens in Excel. That manual layer, built from exports and pulled together by hand, is where the blind spot gets created. Loan administration teams pull from core banking systems, inspection vendors, draw tracking spreadsheets, and email, and by the time that work reaches senior management in a quarterly package, the underlying numbers can be weeks old. Construction progress, budget usage, leasing activity, and collateral performance all move between reporting cycles, not conveniently at quarter-end, so a report built on stale data is actively mispricing the bank's current exposure at the moment decisions get made from it.
The specific risk signals that surface only at the portfolio level, not the loan level
None of the signals that matter most for catching CRE risk early are obscure or hard to define. DSCR compression, revenue decline, margin pressure, liquidity depletion, draw-use creep, covenant breaches, and delayed borrower reporting are all well understood indicators that tend to appear in a loan file before a borrower misses a payment or asks for a waiver. They become useful only when you view them in combination, trend direction and exposure size alongside threshold status, rather than as isolated data points. A DSCR reading on its own tells a credit officer almost nothing. A DSCR trend, a threshold breach, and the exposure amount behind it, shown together, tell that same officer exactly where to look first. That combination, not any single metric, is what separates background noise from an actionable credit signal.
Covenant compliance illustrates the same point at scale. Tracking a single loan's covenants is manageable by hand. Tracking covenant status across several hundred loans is not, and a pattern of borrowers drifting toward breach across a particular asset type or vintage will never surface from individual loan reviews. You only see it once you build one consolidated pass/fail view across every active loan that carries covenant requirements. Without that consolidated view, violations compound quietly, because by the time a manual review catches a breach, the borrower has already had unmonitored time to deteriorate further.
Construction lending carries its own set of signals that exist nowhere outside a portfolio view: draw completion percentage against project timeline, how recently a property has actually been inspected, and variance against the original project budget. Each of these flags overfunding risk or project delay on its own. None of them means much until you set it against the asset's broader performance history, and that again means looking across the book, not at one file.
Concentration signals are inherently cross-book by definition. Exposure broken out by geography, asset type, sponsor, and loan size only functions as a risk management tool once concentration thresholds are set by policy and checked continuously, not reviewed once a quarter after the fact. A strong portfolio report, at any given moment, needs to answer two questions: where is exposure concentrated, and which loans are trending off-track. Together, those two answers show whether a bank's risk controls are actually working or just producing paperwork.
The aggregate numbers show why this matters now rather than hypothetically. CRE loan portfolios at banks grew modestly and reached a new peak in 2025, even as concentration and delinquency rates moved unevenly across different groups of banks, with rising operating costs, higher interest rates, and elevated vacancy pressuring some borrowers' ability to refinance and repay their debt. The FDIC's 2026 Risk Review documents that banks leaned on loan modifications to provide relief, more often at larger institutions, and that conditions in some property markets have stabilized. That unevenness across bank groups is exactly the environment where portfolio-level visibility separates institutions that catch deterioration early from those that find out when an examiner does.
The 2026 Risk Review also confirms that CRE delinquency rates and net charge-off ratios stayed low at the aggregate level. That aggregate calm is misleading on its own, because the same report notes that unevenness across bank groups means the national average is hiding stress that is already concentrated in specific pockets of specific portfolios. The forward risk that makes this urgent is refinancing. A large volume of CRE loans originated when rates were far lower is now approaching maturity, and the borrowers behind those loans face higher debt service costs at the same time as lower property valuations are reducing how much refinance proceeds they can actually raise. That maturity wall is not visible loan by loan. A lender sees that maturity wall only by running a maturity analysis across the full book, which is precisely the kind of exercise loan-level review was never built to do.
A Functional Debt Portfolio Analytics Framework
A functional analytics framework is a decision-support system built around the specific actions a lender actually has to take on a given credit: renew it, keep watching it, downgrade it, request more information, restructure it, or move it to special assets. Everything the framework tracks should trace back to one of those actions, or it is just noise with a nicer interface.
A comprehensive CRE portfolio report has eight components, and loan-level performance data is the base layer, because it feeds everything built on top of it. That base layer covers LTV, DSCR, payment status, and borrower financial health for every credit in the book. From there, the framework needs portfolio concentration analysis broken out by geography, asset type, sponsor, and loan size, checked against thresholds set by policy rather than reviewed after the fact. Construction-specific metrics, draw completion percentage, inspection recency, and budget variance, track the unique risks of construction lending. You need one consolidated pass/fail view across every loan carrying covenant terms, so you don't check loan by loan. Cash flow analysis tracks NOI trends, vacancy rates, and debt service capacity, both at the borrower level and the segment level.
For a commercial lender, the minimum set of metrics worth tracking comes down to seven: total exposure, weighted-average risk grade, past-due exposure, DSCR by borrower and segment, covenant exceptions, top borrower concentrations, and outstanding document requests. Each of those needs to be filterable by relationship manager, branch, sector, geography, loan type, risk grade, and reporting status, because the same number means something different depending on which slice of the book it's describing.
Thresholds are what keep this from collapsing into noise. The combination of a threshold breach, a trend direction, and an exposure amount is what tells a credit officer whether something needs attention today or can wait. A small, slightly overdue document request from a borrower in good standing does not deserve the same escalation path as a large exposure showing declining cash flow for two consecutive quarters, and a framework that treats both the same way will train its own users to ignore it. Borrower watchlists work the same way: they should be generated automatically from exception status tied to covenant terms and routed to whoever owns that relationship, not built from scattered manual notes. Missing documents should be ranked by how many days late they are, the borrower's risk grade, and the size of the exposure involved, not simply listed in the order they came in.
A framework built this way ends up serving two audiences at once without needing two separate systems. It can produce board-level dashboards that replace the manual quarterly spreadsheet exercise, and it can produce audit-ready documentation that holds up under OCC and FDIC examination. Those are two outputs of the same underlying infrastructure, not two different projects. The FDIC's 2026 Risk Review found that banks faced continued weakness in CRE and leaned on loan modifications to manage it. The institutions best positioned to handle that kind of stress are the ones whose monitoring infrastructure flags deterioration early enough that modification is a planned response rather than a scramble. If you carry active construction commitments or portfolios with meaningful concentration, continuous monitoring with exception-driven alerts is the standard to build toward. Quarterly review cycles cannot keep pace with collateral conditions that change between quarters.
AI and the Economics of Continuous Portfolio Monitoring
Portfolio monitoring has always been limited less by analytical ambition than by the quality and speed of the data feeding it. A lender can design the most carefully structured framework described above and still fail to run it in practice, because the inputs, borrower financial statements, tax returns, bank statements, PDFs, spreadsheets, scanned documents, and lender-specific forms, arrive in whatever format the borrower happens to send them in. If those documents land in an email inbox or a shared drive and sit there until someone manually opens and keys them in, the portfolio view stays stale no matter how well the monitoring framework itself is designed.
This is the specific constraint that has made continuous, book-wide monitoring operationally unrealistic for most lenders until recently: not a lack of analytical frameworks, but the sheer cost in staff time of turning a stack of mismatched borrower documents into clean, comparable data every reporting cycle. AI changes that constraint directly by automating the ingestion and standardization step itself. Rather than a loan administrator manually transcribing figures from a scanned financial statement into a spreadsheet, the system ingests the document, standardizes the financial data inside it, runs explainable ratio, cash-flow, and debt-service analysis against it, and surfaces the resulting trends at both the borrower level and the portfolio level. What used to take weeks of manual data entry and reconciliation becomes a process fast enough to actually support continuous monitoring, which is the only kind of monitoring that matches how quickly conditions on the ground can move.